2D Merge (Merge)
This module is the setup for a vehicle dealing with lane-merges. The goal is to quickly move from the leftmost lane to the rightmost lane without crashing into other vehicles.
Note that this setup differs from the 1D-target example in that the demonstrations are provided by the python programs in python-gen (try running merge.py). Demonstrations will be placed into that folder automatically. As a result, the setup does not require filling out robotSets.h, a simulation ASP, a physics model, or their corresponding settings.
Try running the algorithm on the setup (or see snapshots/ for pre-acquired results).
The most useful/informative outputs will be:
- out/aspx/, which stores the synthesized policies. For example, we can see the final policy:
if ha == FASTER and false: return LANE_LEFT if ha == FASTER and flp(lgs(DividedBy(Minus(x, r_x), vx), -1.028642, -35.895672)): return LANE_RIGHT if ha == FASTER and flp(lgs(Minus(r_x, f_x), -38.665745, 0.395329)): return SLOWER if ha == LANE_LEFT and false: return FASTER if ha == LANE_LEFT and false: return LANE_RIGHT if ha == LANE_LEFT and false: return SLOWER if ha == LANE_RIGHT and flp(lgs(Minus(r_x, x), 8.462489, -0.367737)): return FASTER if ha == LANE_RIGHT and false: return LANE_LEFT if ha == LANE_RIGHT and flp(lgs(DividedBy(Minus(x, r_x), l_vx), -0.377488, 10.546384)): return SLOWER if ha == SLOWER and flp(lgs(Minus(x, f_x), -39.469845, -0.228033)): return FASTER if ha == SLOWER and false: return LANE_LEFT if ha == SLOWER and flp(lgs(Minus(x, r_x), -43.102879, -0.396746)): return LANE_RIGHT return ha -
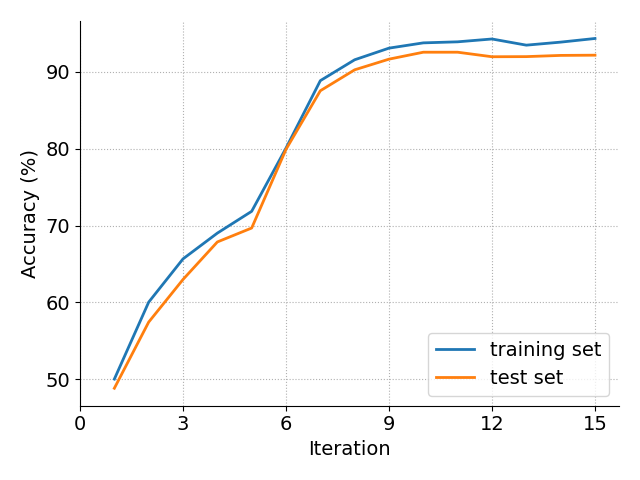
plots/accuracy.png and plots/likelihoods.png, which shows the progress of the EM loop across iterations. Here is a (slightly prettified) version for this task:
-
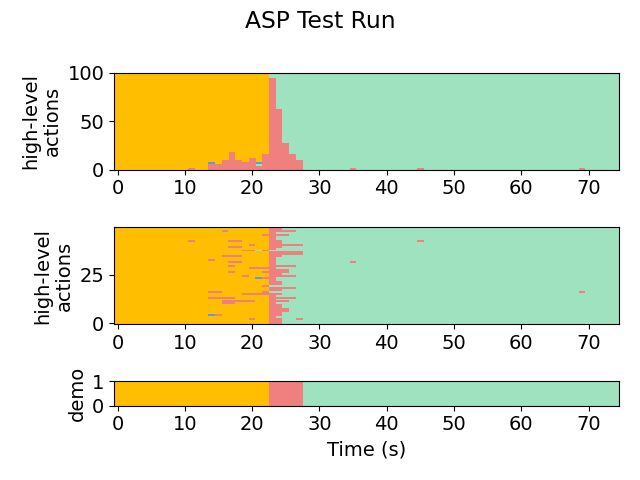
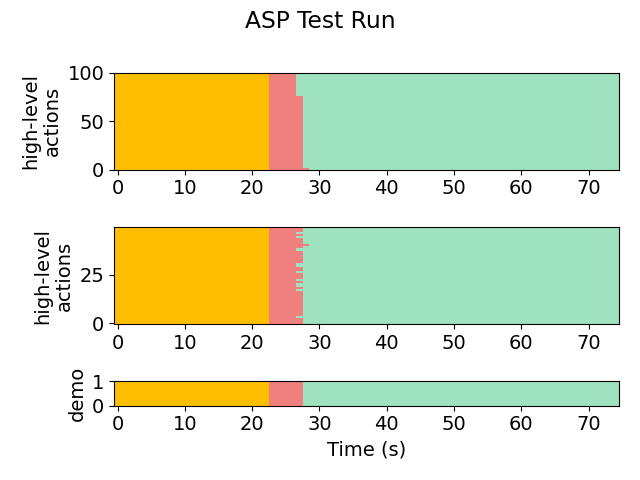
plots/testing/xx-x-graph.png, which gives a visual representation of the action labels selected by the policy on the testing set. The first number in the file name indicates the iteration. For example:
Iteration 1:
Iteration 2:
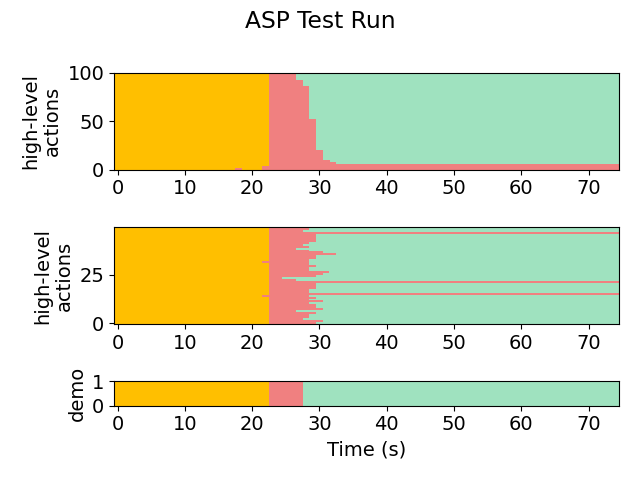
Iteration 9:
-
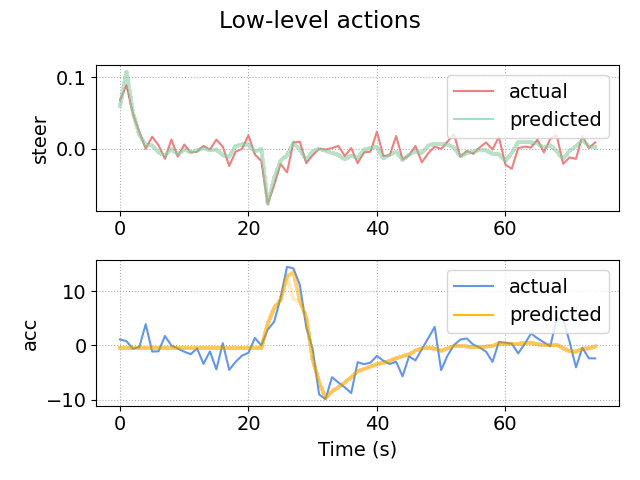
plots/testing/LA-xx-x-graph.png, which gives a visual representation of the low-level observations predicted by the policy on the testing set. For example, here is iteration 9:
We also show the behavior of the synthesized policy directly in the simulator.
Iteration 1:

Iteration 3:

Iteration 8:

We provide the observation model below:
step(action):
    target_acc = 0
    target_heading = 0

    if (action == FASTER)
        target_acc = 45 - v
        target_heading = atan((round(y) - y) / 30)
    else if (action == SLOWER)
        target_acc = v_front  - v
        target_heading = atan((round(y) - y) / 30)
    else if (action == LANE_LEFT)
        target_acc = -0.5
        target_heading = -0.15
    else if (action == LANE_RIGHT)
        target_acc = -0.5
        target_heading = 0.15

    if (target_heading - heading > steer)
        steer = min(steer + 0.08, target_heading - heading)
    else
        steer = max(steer - 0.08, target_heading - heading)

    if (target_acc > acc)
        acc = min(target_acc, acc + 4)
    else
        acc = max(target_acc, acc - 6)